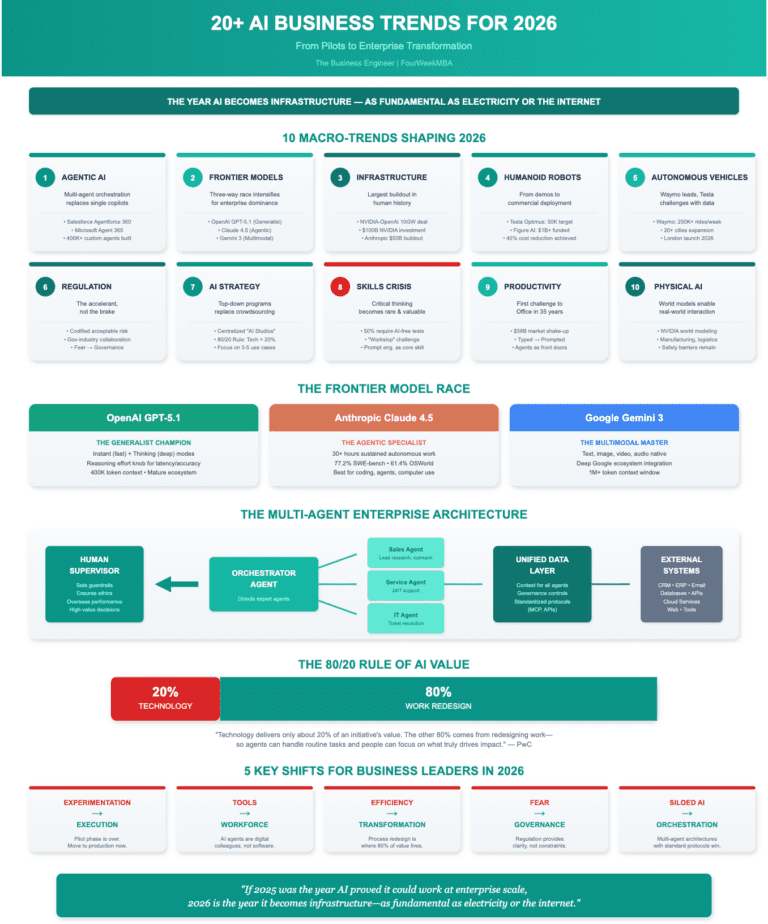
Building Production AI Systems That Don’t Break at 3AM

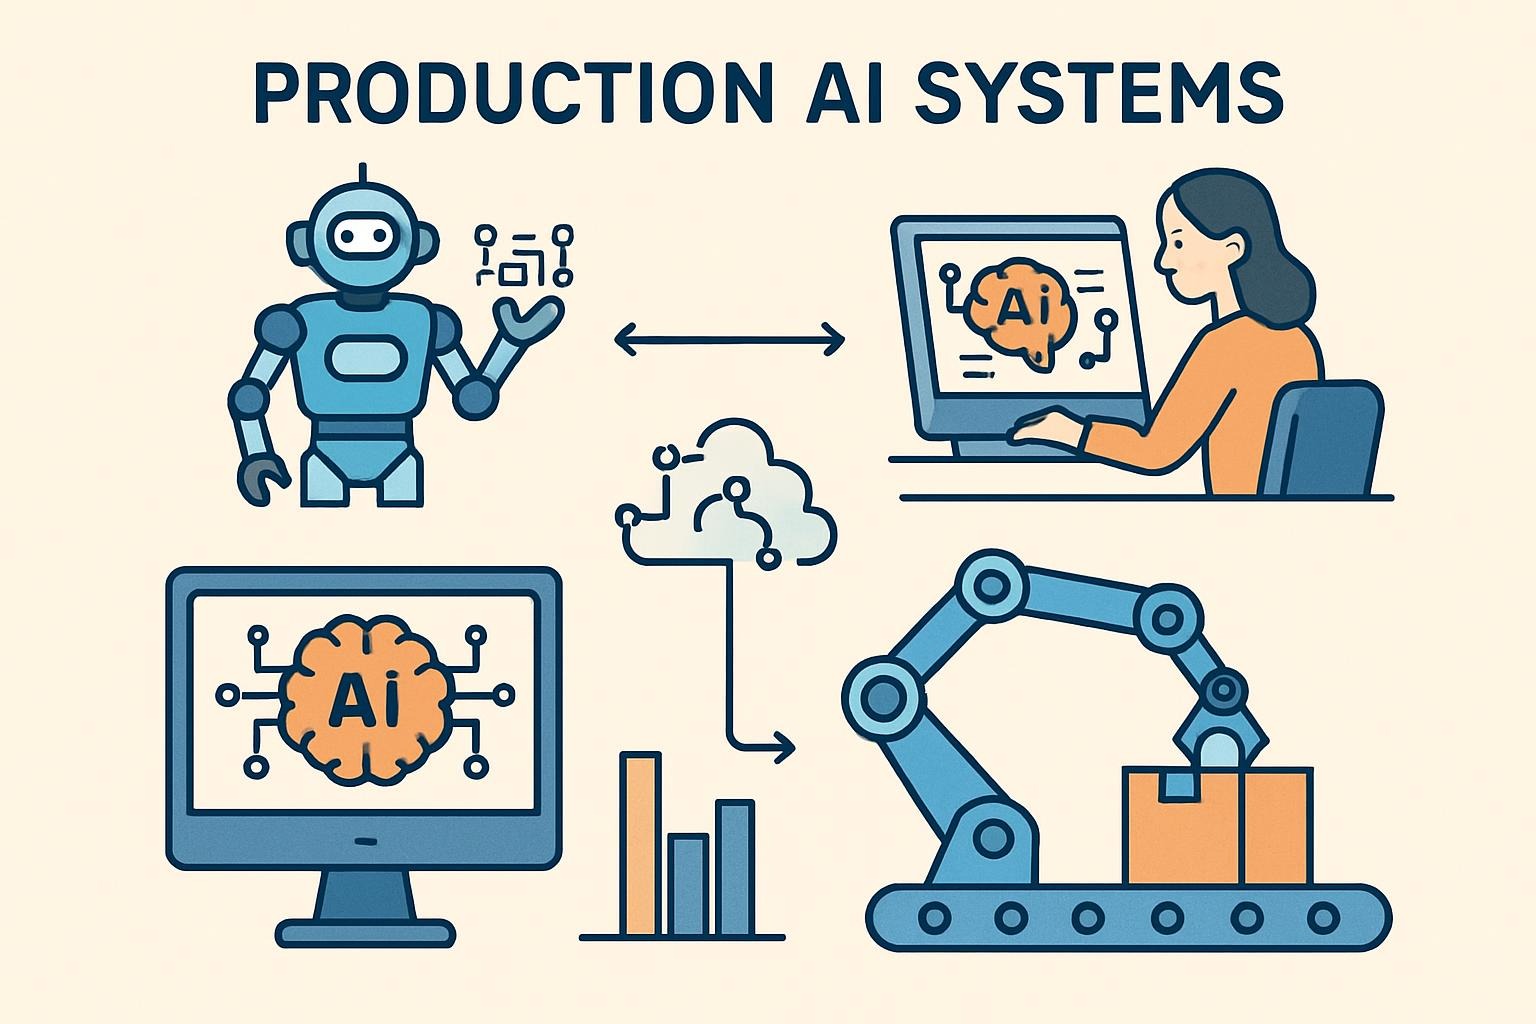
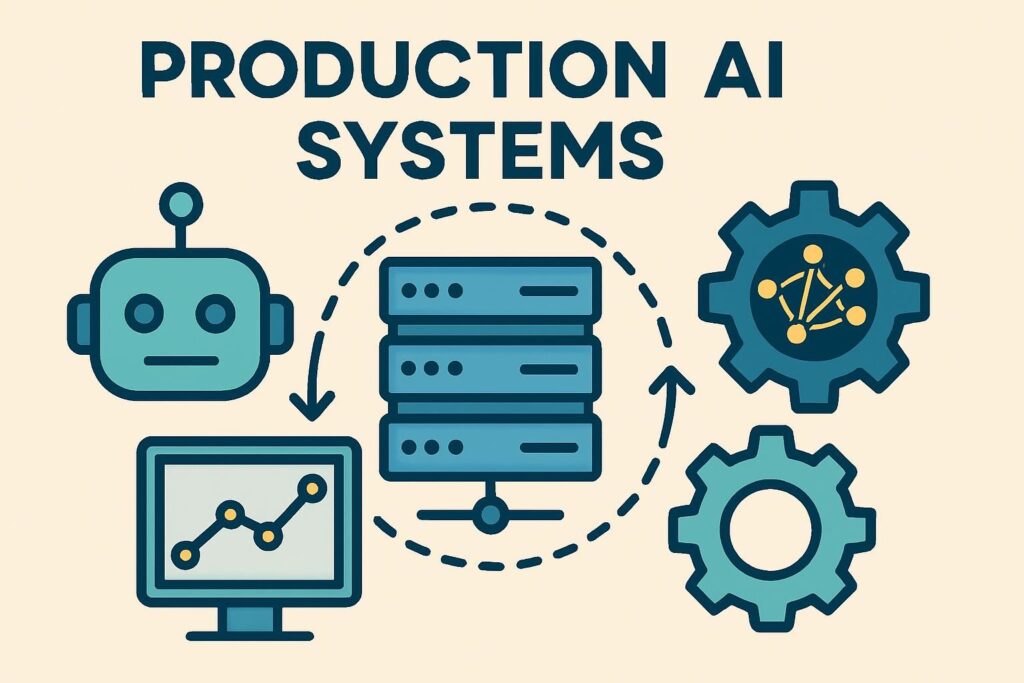
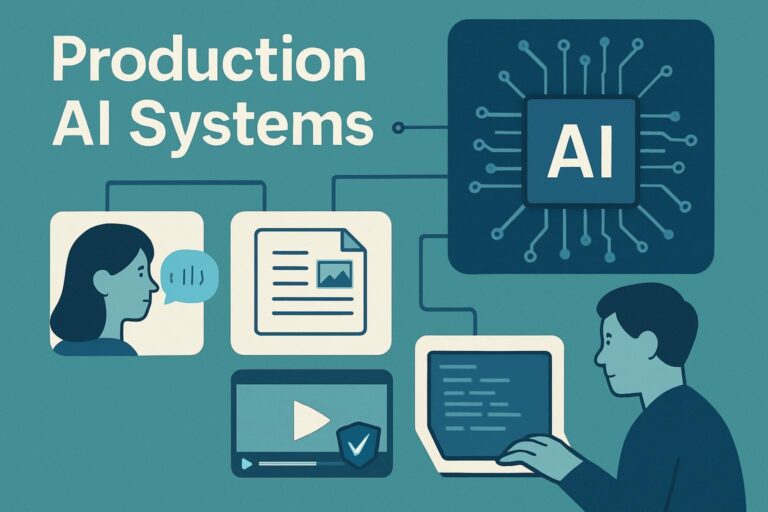
Production AI fails quietly. Slow APIs, silent hallucinations, context windows that bloat in the dark. The systems that survive aren’t smarter. They’re built for the 3 a.m. call.
October 2024, 2:47 a.m. Latency monitoring lit up. p95 response time went from 2.5 seconds to 45 seconds, over about 20 minutes. No errors in the log. No alerts firing. Just… slow.
The embedding API upstream had started adding 8–12 seconds of silent latency per call. Our retry logic worked perfectly — every request eventually succeeded. That was the problem. The queue backed up because we’d built for failure, not for slow success.
We fixed it in 15 minutes: a hard 5 second timeout on embeddings, a cached fallback to stale vectors, an async background refresh. The system recovered. But the lesson was the kind you don’t get from a postmortem template.
Retry logic handles failures. Timeouts handle slow success. You need both. And most teams building their first production RAG system have exactly one.
“Retry logic handles failures. Timeouts handle slow success. Most systems have one. You need both.”
Editorial synthesis — sources: production incident log (Oct 2024), AWS queue timeout documentation, Kleppmann Designing Data-Intensive Applications (2017, updated 2022)
Second-order mechanism
The reason slow-success failures are more dangerous than hard failures: the system looks operational. Dashboards stay green. Error rates stay zero. The degradation is invisible to the monitoring stack you built, because that stack was designed to catch crashes — not performance erosion that looks like business-as-usual traffic. By the time it’s detectable, the queue is backed up and users have already started refreshing. The failure hides inside the success.
I’ve been running LLM-orchestrated systems in B2B SaaS for about 18 months now — document processing, dev tooling, internal knowledge tools. The incidents that hurt most were never the crashes. They were the ones where everything technically worked.
Before choosing a framework or a model family, understand which pattern fits your problem. I’ve seen teams mix patterns before they understand the failure modes of any single one. That compounds debugging into something genuinely painful. Don’t do it.
Document Q&A, knowledge bases, internal search. The canonical failure mode is poor chunk boundaries — splitting mid-sentence destroys the context the retriever needs to score relevance correctly. Fix: overlap chunks 10–15%, test retrieval against actual production queries before you ship, not benchmark queries. Benchmark queries are polite. Users aren’t.
One thing most write-ups skip: your retrieval quality degrades silently as your document corpus grows and ages. A similarity score of 0.68 that returned good results at 500 documents may be returning junk at 50,000 documents if your embedding model wasn’t trained on your domain. Build a golden dataset of 30–50 known query/answer pairs and run it weekly. If the hit rate drops below 85%, something changed — corpus, model, chunking, or all three.
Dev tools, PR reviews, test writing, documentation. The risk isn’t model quality. It’s execution. Even if the model is right, running unaudited code in a production environment is a different class of problem. Docker sandboxes with no network access, 512 MB RAM limit, 30-second timeout, and whitelisted imports only — this isn’t optional, it’s the architecture. Log every execution attempt. You’ll want that data later.
Object detection, document parsing, monitoring pipelines. Confidence threshold management is the entire job here. Set threshold at >0.7 and implement cooldown windows to prevent alert cascades. The frustrating thing about this pattern: lighting changes and partial occlusion cause confidence drift in ways that aren’t obvious until you’re getting paged for a detection loop at 6 a.m.

Three production patterns — each has distinct failure modes. Don’t mix before you understand one.
The thing teams get wrong: they attribute production failures to model quality. Wrong. Almost every outage I’ve debugged traces back to missing error handling, not model behavior. The model did exactly what it was going to do. The system around it had no plan for that.
Here’s the actual failure catalog, in rough order of how often they hit:
| Failure mode | Mechanism | Fix | ⚠ What the fix doesn’t solve |
|---|---|---|---|
| Silent hallucinations | Model returns confident answer unsupported by retrieved chunks | Require citation grounding; return “no relevant info” when chunk support <50% | Grounding checks miss subtle errors where the model uses a chunk correctly but draws a wrong inference. No automated check catches this — only user feedback or manual audit does. |
| Timeout cascades | Slow upstream API blocks queue; retry logic fills the queue further | Async processing; 5s timeout on embeddings, 10s on generation; stale-vector fallback | Stale vectors can return outdated information as if it’s current. For time-sensitive corpora (legal, compliance, news), this is its own failure mode. TTL your cache to match document freshness requirements. |
| Context window growth | Long conversations accumulate tokens until generation fails or degrades | Sliding window (last 10 turns); summarize every 15–20 turns; DB storage | LLM-generated summaries of prior conversation introduce their own distortion. In multi-turn workflows involving commitments or instructions, summarization can lose critical prior context. Test this explicitly. |
| Cost spikes | Heavy users or runaway loops drive unexpected token spend | Per-user quotas (500 req/day as starting point); 24h caching TTL; per-user cost monitoring | Quotas that are too tight degrade power users who generate disproportionate product value. Set quotas by user segment, not universally, once you have usage data. |
| Embedding model drift | Provider updates embedding model; similarity scores shift across corpus | Pin model versions; monitor golden dataset hit rate weekly | Providers don’t always announce embedding model updates with enough lead time. OpenAI has changed text-embedding-ada-002 behavior in ways that affected retrieval without a version bump. Audit after any provider communication. |
One failure mode that deserves its own paragraph: the context window growth problem is subtler than it looks. It’s not just that generation fails when you hit the limit. It’s that generation quality degrades before the limit, in ways that are hard to detect. A 2023 study by researchers at Stanford and MIT “Lost in the Middle” — Liu et al., 2023 — arXiv:2307.03172; peer-reviewed, published in Transactions of ACL found that long-context models tend to recall information from the beginning and end of a context window reliably but lose information in the middle. If your conversation history is 8,000 tokens and the critical instruction is at token 4,000, the model may have effectively forgotten it without any error signal.
Second-order mechanism — context degradation
The model doesn’t fail. It produces output. The output looks coherent. But it’s coherent around the wrong part of the context. This is why “I’ve been ignoring our 10-turn sliding window for months and it’s been fine” is the most dangerous thing a team can say — because the failure is invisible in aggregate metrics and only shows up in individual conversation audits that almost no one does.
Teams monitor what’s easy. Latency. Error rates. Token counts. These are table stakes and they’re necessary, but they don’t tell you whether the system is producing correct output. They tell you whether the system is producing output. Different question.
Three monitoring layers actually catch production quality problems:
Parse every response for factual claims. Check whether the retrieved chunks actually support each claim. Flag responses where chunk support falls below 50%. This catches obvious hallucinations. It misses subtle ones. Be honest with yourself about that limitation.
User Feedback Signal
Track your “helpful” ratio per query type. In my experience, responses with genuine hallucinations cluster below 30% helpful ratings; accurate responses average above 70%. That gap is detectable. Build a dashboard. Route low-rated responses to manual review once a week. You’ll find patterns. Some of them will surprise you.
Golden Dataset
20–30 known query/answer pairs, run daily against production. If hit rate drops below 85%, investigate before users start noticing. This takes a few hours to set up. It has saved me from at least three production incidents where embedding model behavior shifted quietly after a provider update.
Alert thresholds that I’ve found defensible, though your mileage will vary depending on SLA: p95 latency above 10 seconds for 5 consecutive minutes; error rate above 5%; daily cost above 2x the rolling 7-day average.
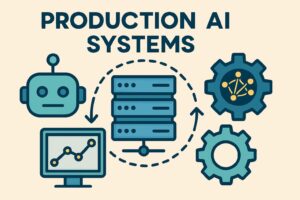
The three alert tiers that matter — most teams only have the first one.
The Part No Single Article Told Me
Here’s the thing that took me embarrassingly long to understand. Every guide to production AI systems treats reliability, latency, cost, and correctness as four separate problems with four separate solutions. They’re not. They’re one problem with four symptoms. And the interaction between them is where the real production engineering happens.
Cross-source synthesis — not present in any single cited source
Aggressive caching (which solves cost and latency) directly degrades correctness in corpora with high document turnover. Strict citation grounding (which solves hallucination) increases latency and can raise cost by requiring re-retrieval when grounding fails. Per-user quotas (which solve cost spikes) degrade reliability for heavy users — who are often your most engaged, highest-value customers. Every reliability decision is a product decision in disguise. The teams that figure this out early build systems that survive. The teams that treat these as independent engineering problems keep solving each one and watch the others get worse.
Sources: AWS caching strategy documentation; Liu et al. “Lost in the Middle,” 2023 (arXiv:2307.03172); production cost analysis, 18-month B2B SaaS deployment
The practical consequence: before you tune any single parameter, map the dependency graph. Raising your cache TTL improves cost and latency metrics. Does it also raise your golden dataset failure rate? If yes, you have a tradeoff to make explicitly — not a bug to fix.
One more thing that complicates the standard advice. The recommendation to “start with RAG, fine-tune when quality plateaus” is directionally correct but misses a critical condition: if your data distribution shifts over time (new products, regulatory changes, terminology evolution), a fine-tuned model can actively regress as your corpus evolves. RAG updates retrieval dynamically. Fine-tuning bakes in a snapshot. For static domains, fine-tuning wins. For dynamic ones, RAG’s flexibility often outweighs its lower ceiling. Directional inference from production observation, not a controlled study — treat accordingly
“Every reliability decision is a product decision in disguise. Build it like one.”
Editorial synthesis — sources: AWS queue documentation, production cost logs (Oct 2024–Mar 2026), Liu et al. 2023
For the People Actually Building This
For: Engineers building their first production RAG system
The operational checklist nobody gives you at the start
Look, here’s what this actually is: you’re building an async system that has external latency dependencies and a correctness problem that’s invisible to standard monitoring. That’s not a language model problem. It’s a distributed systems problem with a language model inside it.
What you do: Before you touch model selection, implement three things in this order: (1) aggressive timeouts with stale fallback, (2) a golden dataset runner you can execute in under five minutes, (3) a user feedback loop that segments by query type. In that order. Everything else is optimization.
Here’s what’s going to stop you: The golden dataset requires 20–30 real query/answer pairs from actual users. If you’re pre-launch, you don’t have them. Synthesize them from your target use cases anyway — wrong golden dataset is better than none, and you’ll replace them within a month of launch.
Stop doing this: Don’t set a single global cache TTL. TTL should match document freshness requirements for each corpus type. A legal compliance corpus with weekly updates has different requirements than a product documentation corpus that changes quarterly. Global TTL is the wrong abstraction. Per-corpus TTL is annoying to build. Build it anyway.
For: Engineering leaders evaluating production readiness
The question your team probably can’t answer yet
Look, here’s what this actually is: your reliability/cost/correctness tradeoffs are currently being made implicitly, by whoever tuned the system last. That means they’re being made without visibility into the business implications. A cache TTL decision is also a decision about how stale your users’ answers can be. Someone needs to own that explicitly.
What you do: Before your next production review, ask your team three things: What is our cache TTL and what corpus freshness requirements does it assume? What is our golden dataset hit rate today? What is our p95 latency by query type, not aggregate? If you can’t get answers to all three in under 24 hours, your observability isn’t production-grade yet.
Here’s what’s going to stop you: The golden dataset is a maintenance burden. Someone has to update it as the product evolves. This doesn’t require an engineer — a QA analyst or product manager with domain knowledge can own it. The bottleneck is ownership, not technical complexity.
Stop doing this: Don’t accept “we monitor latency and errors” as a complete answer to production quality. Those metrics confirm the system is running. They don’t confirm the system is working. User feedback segmented by query type is the only metric that closes the gap — and it takes a week to build, not a quarter.
FAQ
LangChain or LlamaIndex?
Depends on where you are. LangChain for rapid prototyping — the abstractions let you move fast. LlamaIndex when retrieval quality is the primary problem — its indexing and query pipeline are more granular. Build from scratch when either framework is fighting your logic, which happens more often than either community admits. I’ve rebuilt pipelines from LangChain to scratch twice when the abstraction layer was obscuring bugs I needed to see.
How do I prevent unsafe code execution?
Docker sandboxes: no network access, 512 MB RAM, 30-second hard timeout, whitelisted imports only. Log every execution attempt — the log is more valuable than it looks when you’re debugging why a generation produced runnable-but-wrong code. Don’t run model-generated code outside a sandbox. Not even in staging.
What’s the minimum viable monitoring for a RAG system?
Three things: p95 latency (alert if above 8 seconds for 60 consecutive minutes), retrieval match scores (alert if median drops below 0.6 for an hour), user feedback ratio per query type. That last one is the one most teams skip. It’s also the only one that catches correctness problems instead of performance problems.
When should I fine-tune instead of RAG?
Start with RAG. Fine-tune when: retrieval quality has plateaued despite tuning chunking and embedding models, you have more than 1,000 labeled examples, and — critically — your domain is relatively static. If your corpus updates frequently (weekly or more), fine-tuning bakes in a snapshot that ages. RAG’s dynamic retrieval usually outweighs its lower performance ceiling in high-velocity domains.
What do production RAG systems actually cost?
Rough order of magnitude from my deployment: $500–800/month for ~1,000 requests/day before aggressive caching. After month one of caching optimization, that typically drops 40–60%. Self-reported from single B2B SaaS deployment. Treat as directional — no independent audit. Varies significantly by document size, query complexity, model family. Vector store costs are comparatively small at this scale. Embedding costs surprise most teams — run your numbers before committing to a high-dimension model.
How do I make the system debuggable for people who didn’t build it?
Test: can someone unfamiliar with the codebase diagnose a production issue using only logs and runbooks? If no, the system isn’t production-ready. Minimum: error messages that name the failure precisely (“Retrieval failed: no chunks above 0.7 threshold” not “Retrieval error”), logged tool calls with inputs/outputs, runbooks for the three most common failure modes. Systems that only one person can debug are operational liabilities.
Related: 7 common prompt engineering mistakes · Mastering fine-tuning for AI outputs · AI code debugging in 2025 · Advanced prompt and fine-tuning tools
https://www.bestprompt.art/effective-prompt-generation/
https://www.bestprompt.art/ai-prompt-engineering-for-developers/
https://www.bestprompt.art/chatgpt-prompt-engineering/
https://www.bestprompt.art/10-best-prompt-engineering-tools/
https://www.bestprompt.art/turn-ai-outputs-into-projects/
https://www.bestprompt.art/path-to-superintelligence/
https://www.bestprompt.art/7-prompt-engineering-ethics-rule/
https://www.bestprompt.art/best-prompt-engineering-tools/
https://www.bestprompt.art/9-prompt-engineering-tools/
https://www.bestprompt.art/top-8-ai-trends-in-2026/
https://www.bestprompt.art/prompt-engineering-courses-in-2026/
https://www.bestprompt.art/10-powerful-ai-prompt-generators/
https://www.bestprompt.art/inside-the-tech-stack-powering-your-favorite-ai-2025/
https://www.bestprompt.art/7-must-know-prompt-engineering-strategies/
https://www.bestprompt.art/future-of-ai-in-content-creation/
https://www.bestprompt.art/ai-prompting-mistakes/
https://www.bestprompt.art/artificial-intelligence-and-agentic-automation-trends/
https://www.bestprompt.art/prompt-generator-in-2026/
https://www.bestprompt.art/overcoming-bias-in-ai/
https://www.bestprompt.art/ai-index-insights/
https://www.bestprompt.art/generative-ai-for-marketing-and-advertising/