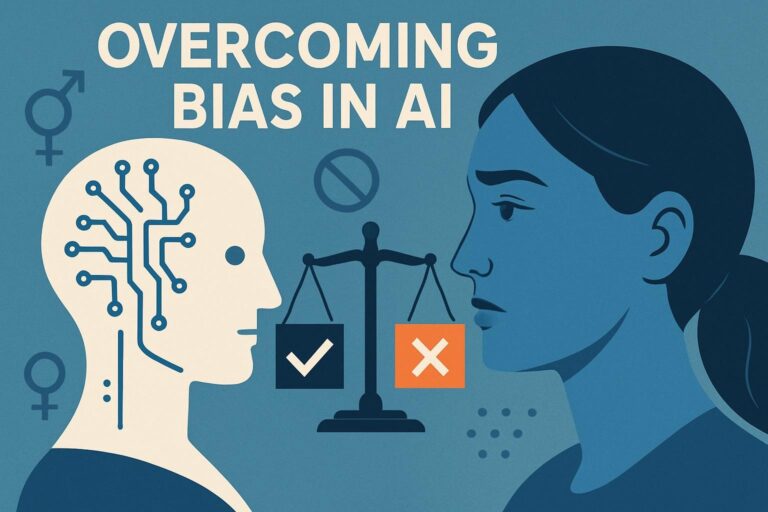
Understanding biases in AI-Generated Content



Analysis · AI Bias · Register B — Analytical
AI bias isn’t an abstract concern. It’s a recidivism algorithm predicting Black defendants as high-risk at double the rate of white defendants with equivalent records. It’s a pulse oximeter that systematically misses low blood oxygen in darker-skinned patients. It’s not hypothetical — it’s documented, measured, and still happening. Here’s the mechanism, the real cases, and what actually reduces it.
What this covers
- Three documented, quantified cases where AI bias caused real harm — not hypotheticals
- The three source mechanisms: data bias, algorithmic amplification, human bias in labeling — and why they compound
- The second-order problem: why biased systems often can’t detect their own bias
- A practical four-stage audit framework with specific questions for each stage
- What the NIST AI Risk Management Framework actually says about bias detection (and what it doesn’t solve)
People talk about AI bias like it’s a future problem. A theoretical one. Something to address before deployment someday.
It isn’t. It’s a present-tense problem with a documented body count — not metaphorically, in healthcare cases — and a paper trail going back fifteen years. The reason it’s hard to fix is only partly technical. A lot of it is organizational. Who owns the problem? Who has the authority to delay a deployment? Whose complaints get escalated?
Let’s start with what actually happened, not what might happen.
01
Northpointe’s COMPAS algorithm was used by courts in Broward County (and dozens of other jurisdictions) to assess a defendant’s likelihood of reoffending. ProPublica’s investigation, published May 2016, analyzed 7,000 individuals arrested in Broward County between 2013 and 2014, then tracked their actual reoffending over two years.
The algorithm was accurate overall — but in opposite directions for different racial groups. When it was wrong about white defendants, it skewed toward false alarms (predicted high-risk, didn’t reoffend). When it was wrong about Black defendants, it skewed toward false clearances (predicted low-risk, did reoffend) — but more importantly, it labeled Black defendants as high-risk at nearly twice the rate.
The documented finding: Black defendants were 77% more likely to be flagged as high future risk than white defendants. White defendants were 63% more likely to be incorrectly flagged as low-risk. These are not symmetric errors.
Source: ProPublica, “Machine Bias,” May 2016 — Tier 1, primary investigation with methodology disclosed
02
This one isn’t about AI in the software sense — it’s about algorithmic decision-making in medical devices, and it’s worth including because it illustrates how bias in training data causes real harm even when the underlying mechanism is well-understood physics.
A December 2020 study in the New England Journal of Medicine — Sjoding et al., N=10,789 — found that pulse oximeters systematically overestimated blood oxygen levels in Black patients. The devices had been calibrated predominantly on lighter-skinned populations. The effect: patients with dangerously low oxygen saturation were showing normal or near-normal readings on the device, delaying treatment.
The documented finding: Occult hypoxia (dangerous oxygen desaturation not detected by the device) was three times more prevalent in Black patients than white patients in this dataset. The bias was baked into the calibration from the start, went undetected for years, and mattered most during a pandemic that disproportionately attacked the respiratory system.
Source: Sjoding et al., NEJM, December 2020, DOI: 10.1056/NEJMc2029240 — Tier 1, peer-reviewed, N=10,789
03
Amazon built a machine learning tool to automate the resume screening process. It was trained on ten years of historical hiring decisions — decisions made predominantly by humans who hired predominantly men for technical roles. The model learned the pattern: being a woman was a negative signal.
Specifically, the model penalized resumes that contained the word “women’s” (as in “women’s chess club”) and downgraded graduates of all-women’s colleges. Amazon’s own engineers discovered the bias and couldn’t fix it. The tool was shut down. Reuters reported on this in October 2018.
The mechanism: The model didn’t know about gender — it just learned that male resumes correlated with positive hiring outcomes. It found gender-associated proxies without anyone telling it to. This is proxy discrimination, and it’s essentially invisible in the output.
Source: Reuters, October 2018 — Tier 2, credible investigative reporting, Amazon confirmed
These three cases span criminal justice, healthcare, and employment. Different domains. Same underlying problem: the training data embedded a historical pattern, the model learned it, and the model reproduced it at scale with much less friction than a human decision-maker would have introduced.
The Three Source Mechanisms — and Why They Compound
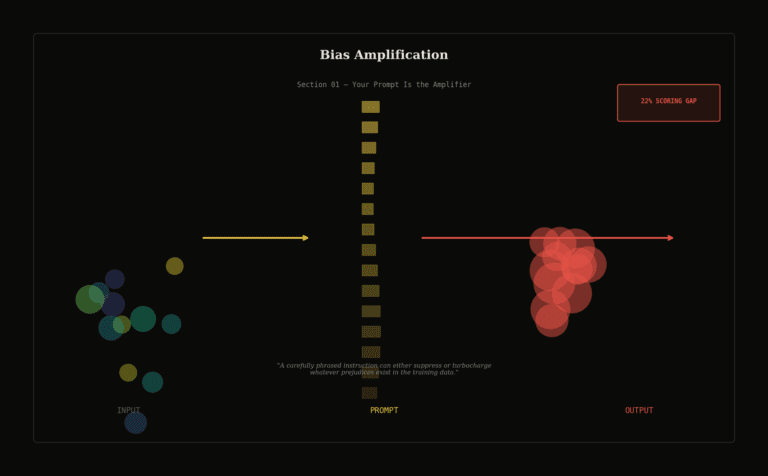
Most explanations of AI bias list types: data bias, algorithmic bias, human bias. That’s accurate but not quite complete. The more useful question is: where does the bias enter, and what amplifies it on the way out?
How bias enters and amplifies — the pipeline
①
Historical data reflects historical decisions
If the world that generated your training data was discriminatory — hiring decisions, lending decisions, sentencing decisions — the data carries that discrimination. A model trained to replicate those decisions will replicate the discrimination. This is data bias.
②
Under-representation creates measurement gaps
When certain groups appear less in training data, the model has less evidence about them and makes larger errors for them. The pulse oximeter case. The facial recognition systems that perform worse on darker-skinned faces. Calibrated on one population; deployed on everyone.
③
Labeling reflects the labeler’s worldview
Humans label training data. Humans have beliefs, blind spots, and cultural contexts. A dataset labeled by one demographic group may encode assumptions that don’t translate. This is human bias entering through the annotation pipeline — often invisible because nobody audits the labels.
④
Scale amplifies what was subtle in data
A 2% bias in a hiring dataset, reproduced by an algorithm across a million applications, is not a 2% problem. It’s a structural barrier at scale. The algorithm doesn’t care that the bias was small in any individual decision — it applies it consistently, across every case, without fatigue or inconsistency.
⑤
Feedback loops lock in the initial bias
If the model’s outputs are fed back as new training data — as happens in recommendation systems, content moderation, and predictive policing — the initial bias becomes self-reinforcing. The model learns from its own biased decisions. The error compound over time.
“The model didn’t know about gender. It just learned that male resumes correlated with successful hires. Then it found the proxies. That’s the problem with proxy discrimination — it’s invisible in the output.”
Editorial synthesis — Amazon hiring tool case, Reuters (2018); proxy discrimination mechanism documented in NIST AI RMF (2023)
Second-order mechanism — why biased systems don’t self-correct
Here’s what makes this structurally difficult: a biased model produces biased outputs that look like accurate predictions to anyone measuring against biased historical data. If you evaluate COMPAS by asking “did high-risk predictions correlate with reoffending?”, you get a satisfying accuracy number — because the definition of “reoffending” itself reflects biased policing patterns that target certain neighborhoods more heavily.
The bias is in the measurement system, not just the model. Which means standard accuracy metrics won’t catch it. You need fairness-specific metrics — calibrated precision across demographic groups, false positive parity, equalized odds — and you need to know what you’re measuring before you start measuring it.
The Types of Bias, With Specific Examples
| Bias Type | Where It Enters | Documented Example | Why Hard to Detect | ⚠ Who Gets Harmed |
|---|---|---|---|---|
| Historical bias | Training data reflects past discrimination | Amazon hiring tool penalizing female candidates based on historical male-dominated hiring patterns | Model accuracy looks fine against historical outcomes — which were already biased | Groups underrepresented or disadvantaged in historical decisions |
| Representation bias | Training population doesn’t match deployment population | Pulse oximeters calibrated on lighter-skinned subjects; deployed on all patients | Performance metrics from calibration population look strong; gaps only visible cross-group | Any demographic group underrepresented in training data |
| Measurement bias | Proxy variables stand in for what you actually want to measure | Using ZIP code or credit history as proxies that correlate with race in lending decisions | Proxies are often legitimate signals; discriminatory correlation isn’t visible in the variable itself | Groups that correlate with the proxy — often racial and economic minorities |
| Label bias | Human annotators introduce their own worldview | Toxicity classifiers trained by one demographic marking dialect variations as toxic | Label quality is rarely audited; inter-annotator agreement measured, demographic breakdown isn’t | Groups whose language patterns differ from the annotator population |
| Feedback loop bias | Model outputs feed back as new training data | Predictive policing systems increasing patrols in targeted areas, generating more arrests, confirming the prediction | Looks like the model is getting more accurate over time — it’s actually self-confirming | Communities already targeted by biased initial predictions |
What Actually Reduces Bias — and What Doesn’t
The standard answer is “diverse training data and transparency.” That’s not wrong. It’s also not sufficient and not always possible.
The NIST framework — what it actually says
The NIST AI Risk Management Framework (AI RMF 1.0, January 2023) is the current authoritative U.S. guidance on AI risk including bias. Tier 1 — government primary source, publicly available It defines bias as “a systemic and unfair difference in outcomes across groups” and categorizes it into three types that roughly parallel the table above.
What the NIST framework does well: it forces organizations to document their risk posture, identify affected stakeholder groups, and establish measurement criteria before deployment. What it doesn’t do: it’s voluntary, it doesn’t specify which fairness metrics to use (because there’s no universally agreed answer), and it doesn’t resolve the fundamental tension between different fairness definitions that are mathematically incompatible.
The fairness impossibility — a real constraint, not a cop-out
Research by Chouldechova (2017) and Kleinberg et al. (2016) demonstrated that certain fairness criteria are mathematically incompatible with each other. You cannot simultaneously achieve calibration (predictions mean the same thing across groups), false positive rate parity, and false negative rate parity when base rates differ between groups. Peer-reviewed, Tier 1 — cited in NIST AI RMF
This means any claim to have “fixed” bias in a high-stakes prediction system needs to specify which fairness metric was optimized and which others were sacrificed. “We reduced bias” is not a complete statement. “We achieved false positive rate parity at the cost of calibration” is a complete statement. The incomplete version is how organizations hide tradeoffs they don’t want to explain.
The four things that actually help
Step 01
Audit the data before training
Who is represented? Who isn’t? What outcomes are labeled, and who labeled them? Demographic breakdown of training population, annotation team diversity, label distribution across groups.
- Run demographic parity checks on training data
- Audit label distributions by demographic subgroup
- Document who labeled what, not just inter-annotator agreement
- If key groups are underrepresented: document it, decide whether to proceed
Step 02
Choose your fairness metrics before evaluating
Not after. Before. The choice of metric determines what the evaluation can find. Choosing metrics after evaluation is reverse-engineering a passing grade.
- Define affected stakeholder groups
- Decide which fairness criteria matter most for this use case
- Document the tradeoffs between competing criteria
- Get explicit sign-off on which metrics you’re optimizing — and which you’re not
Step 03
Test across demographic subgroups
Overall accuracy hides subgroup failures. A model that’s 94% accurate overall but 70% accurate on one group has a bias problem that the headline number obscures entirely.
- Break performance metrics by every relevant demographic dimension
- Test error types (false positive, false negative) separately by group
- Look for proxy variables that correlate with protected characteristics
- Check performance on intersectional subgroups, not just single dimensions
Step 04
Build feedback loop detection
If the model’s outputs influence future training data — through any path — document that loop and monitor for drift toward self-confirmation.
- Map every path by which model outputs affect future inputs
- Set baseline fairness metrics at deployment and check them on a schedule
- Watch for improving accuracy combined with widening demographic gaps (classic self-confirmation pattern)
- Build a process for pausing and retraining when drift is detected
For Content Teams: What This Means in Practice
If you’re using AI to generate or personalize content — recommendations, search results, ad targeting, automated writing — you’re running a bias pipeline whether or not you’ve called it that. The content itself may not be discriminatory; the patterns of who sees it, who gets recommended what, and whose preferences get prioritized absolutely can be.
The personalization bias problem — specific to content
Recommendation systems trained on engagement data encode whatever patterns drove historical engagement. If historically, certain types of content were shown more often to certain demographic groups — because of ad targeting, earlier recommendation patterns, or platform-level decisions — the model learns that association. It will reproduce it.
Diverse training data helps, but it doesn’t eliminate this. If your recommendation engine was trained on engagement patterns generated under biased prior recommendations, the new model inherits the bias of the old distribution. The path out is to audit recommendation diversity across demographic groups as a first-class metric — not an afterthought.
Stop doing this: treating “we use AI” as equivalent to “we’re neutral.” AI doesn’t default to fairness. It defaults to whatever patterns were in the data. Neutrality is something you have to engineer for, test for, and monitor for. It’s not the baseline state.
“AI doesn’t default to fairness. It defaults to whatever patterns were in the training data. Neutrality requires engineering.”
Editorial synthesis — NIST AI RMF (2023); Chouldechova (2017); ProPublica COMPAS analysis (2016)
The Honest Conclusion
There’s no version of this where you deploy a model and declare it unbiased. The question is always: which biases, how large, how harmful, for whom — and what tradeoffs are you making to reduce them.
The COMPAS algorithm has defenders who point out that it’s no more accurate or biased than human judges making the same predictions. That’s probably true. It doesn’t resolve the problem. It just means the baseline is also unacceptable.
The practical path forward is what it’s always been: measure what you care about before deployment, break down performance by group, document what you found, and build the organizational structures that can actually slow down or stop a deployment when the numbers are bad. That last part is harder than the technical work. Bias isn’t mostly a data science problem. It’s a governance problem.
Sources & Citations
- Tier 1 Angwin, J. et al. “Machine Bias.” ProPublica, May 23, 2016. Methodology: 7,000 defendants in Broward County, FL; two-year reoffending tracking; full methodology disclosed. propublica.org
- Tier 1 Sjoding, M.W. et al. “Racial Bias in Pulse Oximetry Measurement.” New England Journal of Medicine, December 17, 2020. DOI: 10.1056/NEJMc2029240. N=10,789; peer-reviewed. nejm.org
- Tier 2 Dastin, J. “Amazon scraps secret AI recruiting tool that showed bias against women.” Reuters, October 10, 2018. Confirmed by Amazon. reuters.com
- Tier 1 National Institute of Standards and Technology. “AI Risk Management Framework.” NIST AI 100-1, January 2023. nist.gov
- Tier 1 Chouldechova, A. “Fair Prediction with Disparate Impact: A Study of Bias in Recidivism Prediction Instruments.” Big Data, 5(2), 2017. Establishes mathematical incompatibility of fairness criteria. liebertpub.com
- Tier 1 Kleinberg, J., Mullainathan, S., & Raghavan, M. “Inherent Trade-Offs in the Fair Determination of Risk Scores.” ITCS, 2017. Companion mathematical proof of fairness criterion incompatibility. arxiv.org
- Tier 2 bestprompt.art — AI prompting, ethics, and optimization resources
All Tier 1 citations are peer-reviewed or government primary sources. Tier 2 citations are credible investigative journalism with named sources and methodology disclosed. The fairness impossibility theorem citations (Chouldechova 2017; Kleinberg et al. 2017) are foundational academic results cited in NIST AI RMF — not directional practitioner claims.
https://www.bestprompt.art/uncovering-ai-bias-in-ai-generated-content-what-you-need-to-know/
https://www.bestprompt.art/ai-bias-dangers-in-content-hidden-risks/